
Garmin Guru Deep Dive: Decoding the Internal Response to 4-Minute VO2max Intervals
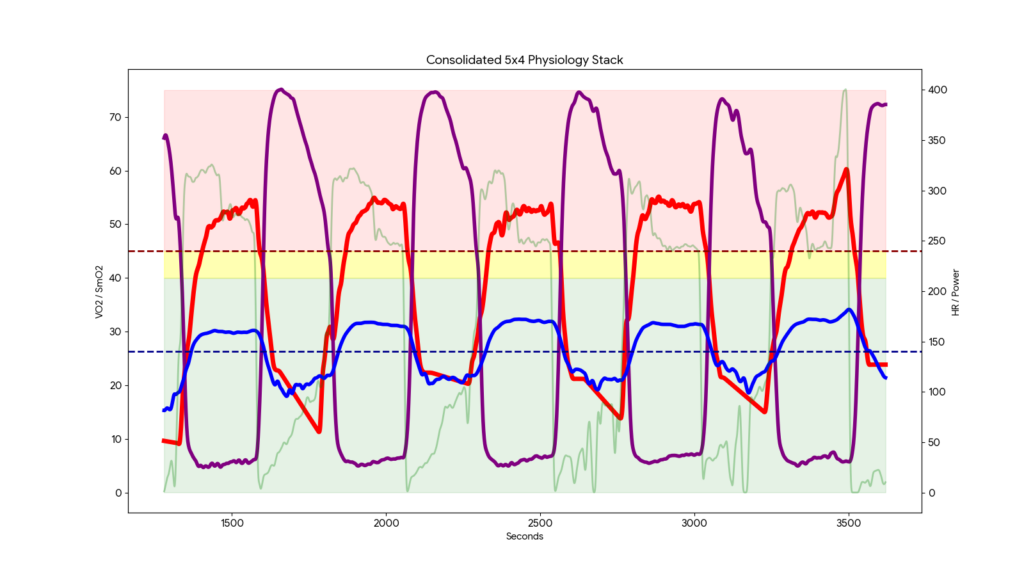
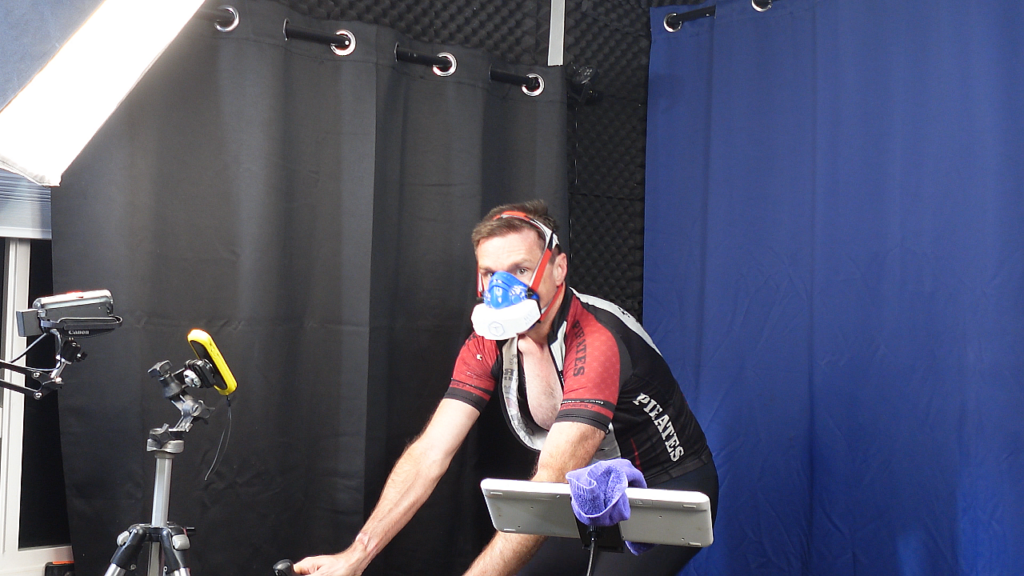
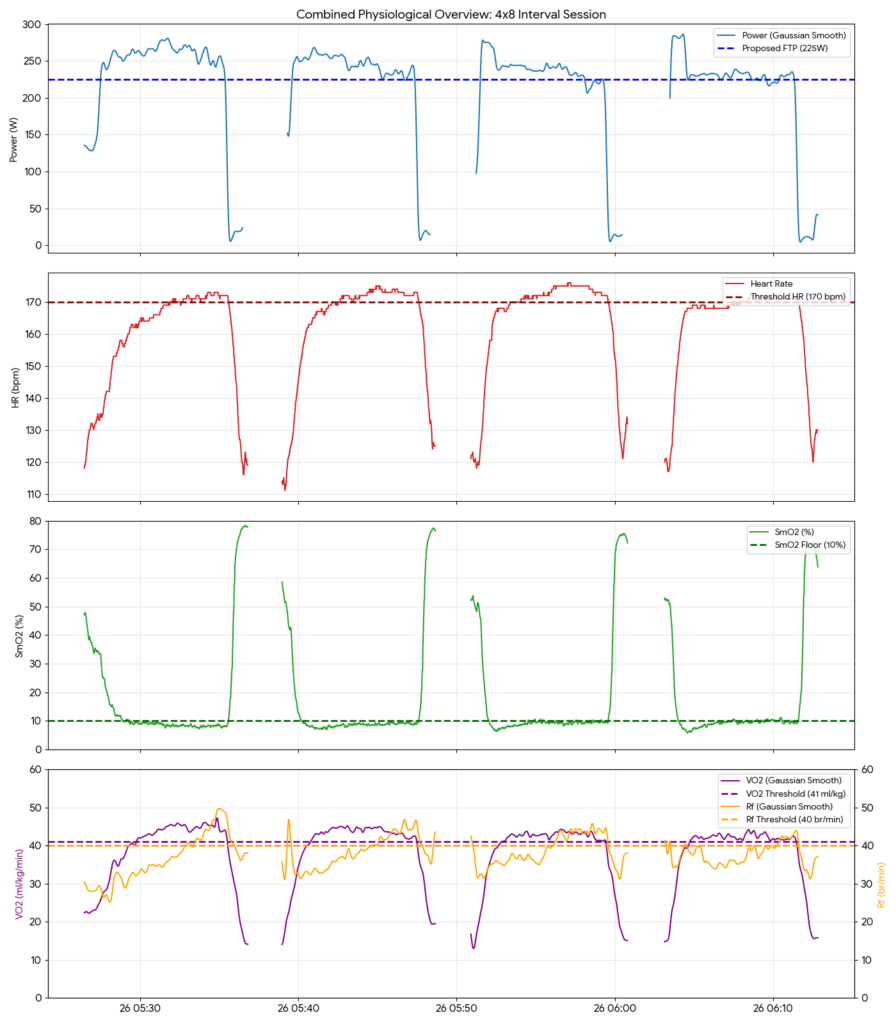
Garmin Guru Deep Dive: Decoding the Internal Response to 4-Minute VO2max Intervals Today’s session of 4-minute VO2max intervals was a masterclass in why I lead with physiology, not physics. As the Garmin Guru at Online Bike Coach, I’m constantly looking for the “truth” behind the numbers. Today, that truth was found in gas exchange and […]
Decoding the Flux: How the Reverse Fibonacci Protocol Re-Maps Your Threshold
Beyond the Score The Garmin Guru Series | Decoding the Fast-Adapter | By OnlineBikeCoach.com Programming Reverse Fibonacci intervals is the ultimate way to shatter the lie of the “Static Zone” in high-performance cycling. We move past the idea that a single FTP test or a heart rate formula from a 1980s textbook is […]
Physiology First: Navigating a “Red Light” Morning with AlphaHRV
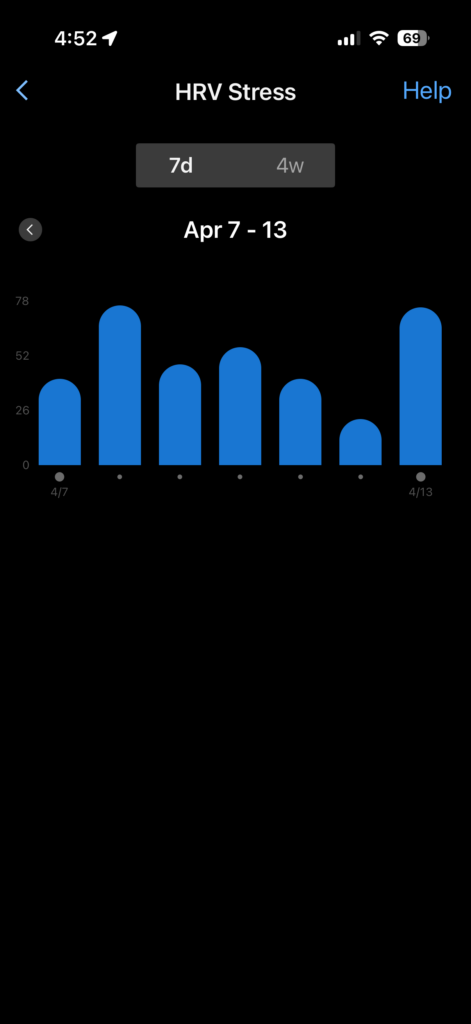
Physiology First: My Red Light Recovery Ride This morning was a masterclass in why I apply a Physiology First framework to every session, looking at the internal engine before I look at the wattage. Between a late meal and the devastating news about my friend Murray being struck by a motorist—suffering a serious […]
Decoding the Hard-Start: How Ronnestad Intervals Impact Garmin Stamina & Training Effect
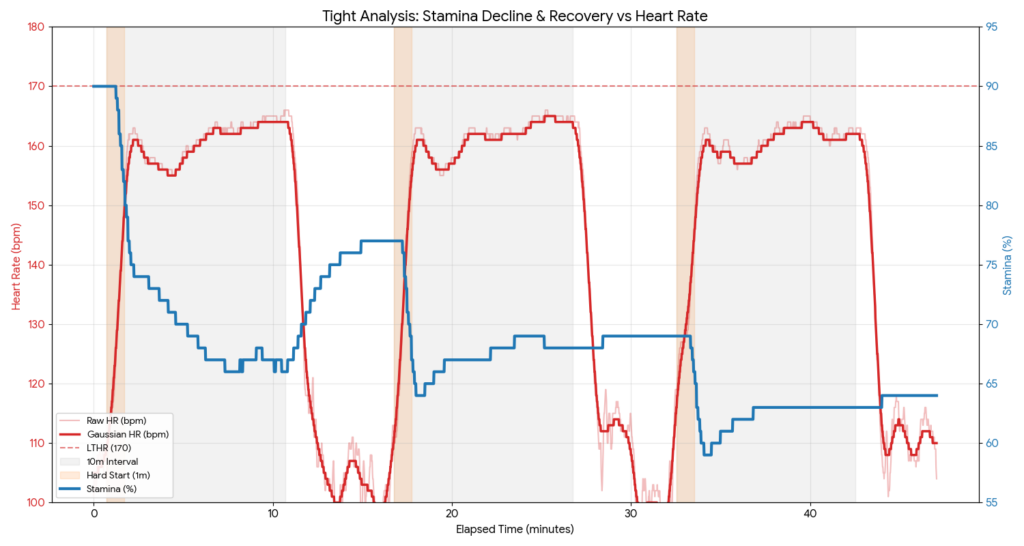
The “Hard-Start” Evolution: Pushing the Limits of the Rønnestad Protocol Testing the Ronnestad Hard-Start Intervals protocol this week provided a fascinating look at oxygen kinetics and internal load. Before this session, I attempted to link my VO2 Master to the phone for a full metabolic calibration. Despite several attempts, the mask simply wouldn’t handshake. Rather […]
Living in the Parabolas: My Deep Dive into the “VO2 State”
Living in the Parabolas: Decoding Metabolic Inertia and the Billat 90/90 In our last deep dive, we dissected the steady-state grind of 5×3 and 4×8 intervals. Those workouts are the bread and butter of threshold development. However, today we are stepping into the “red zone” to explore Veronique Billat’s 90/90 Metabolic Inertia. Using the combined […]
Physiological Threshold Vs. FTP: The Power Illusion
The Power Illusion: Resetting 20 Years of Training with Physiological Data After 20 years of cycling, I realized my FTP wasn’t telling the whole story of my actual physiological threshold. My identity as a cyclist was defined by a single, flickering number on a head unit: Watts. If you’ve spent any significant time in the […]
VO₂max Intervals: The Most Misunderstood Workout in Cycling—And How to Do Them “Right”
VO2Max State vs. Zone: What’s Happening Under the Hood https://youtube.com/shorts/gjB6seZEVec?feature=share I recently started using my VO₂Master again. In this session, I wanted to explore the VO2max state vs zone debate by looking at the actual physiological cost of high-intensity efforts. Earlier this week, I performed five separate 3-minute intervals at an intensity well above […]
Use the MOXY Monitor to Dial in Your Cycling Warm-Up
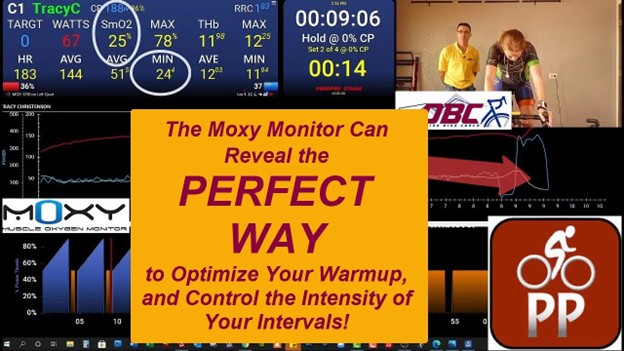
How to Use the MOXY Monitor to Dial in Your Cycling Warm-Up and Spot Interval Fatigue Use short, sharp efforts to drive muscle oxygen down, then ghost pedal until you hit a higher active saturation. Higher ceilings, higher floors. The MOXY Monitor is one of the fastest ways to see what your legs are actually […]
The Moxy SmO₂ Sensor: What It Is, How It Works, and How It Makes You Faster
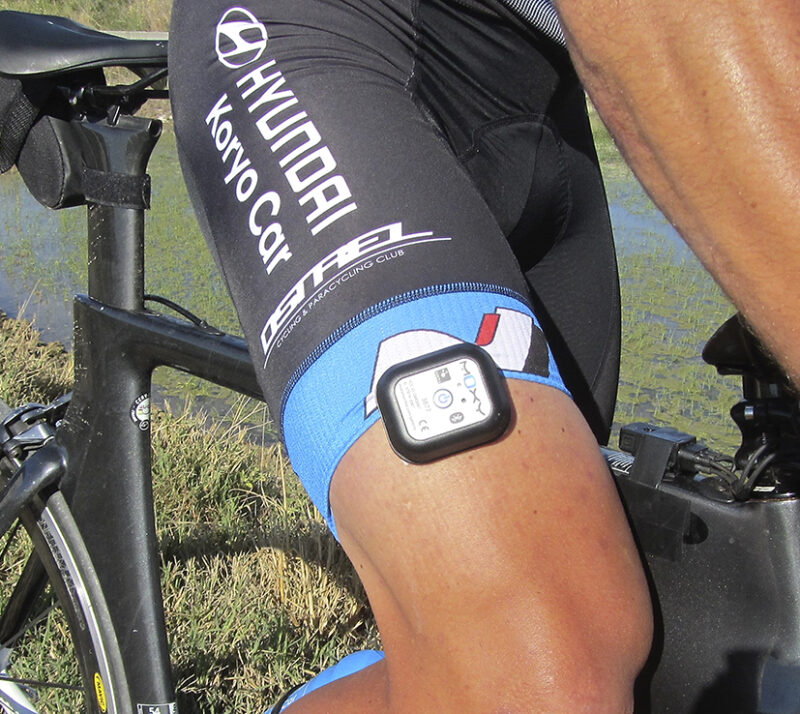
Unlock the secrets of your muscles with the Moxy SmO₂ sensor! Gain real-time insights into your muscle oxygen levels during every ride, allowing you to train smarter and recover better. Say goodbye to guesswork as you monitor your SmO₂ alongside power and heart rate. Whether refining endurance or mastering recovery, this tool optimizes your performance. Harness the power of SmO₂ and elevate your cycling game—your body will thank you!
SMO2 Levels and Base Training
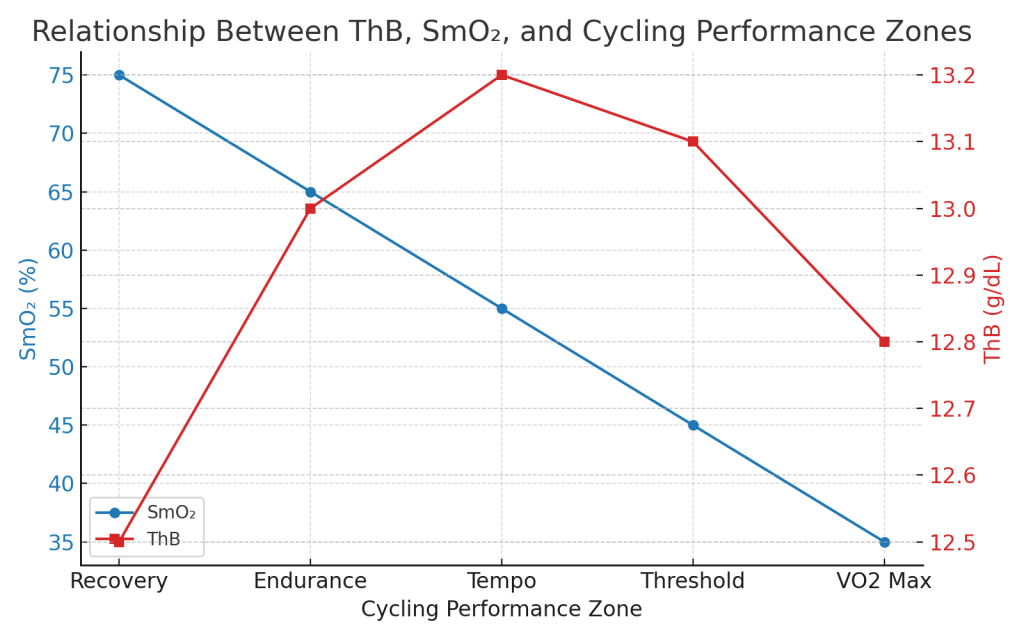
When it comes to cycling, many believe that hard training is the key to speed. However, what if riding easier while tracking your muscle oxygen levels could make you stronger? The Moxy SmO₂ sensor measures the oxygen in your muscles in real time, helping optimize your training. Learn how understanding your SmO₂ can boost endurance, enhance recovery, and improve performance. Ready to ride smarter and get stronger? Explore the muscle oxygen data and unlock your cycling potential!