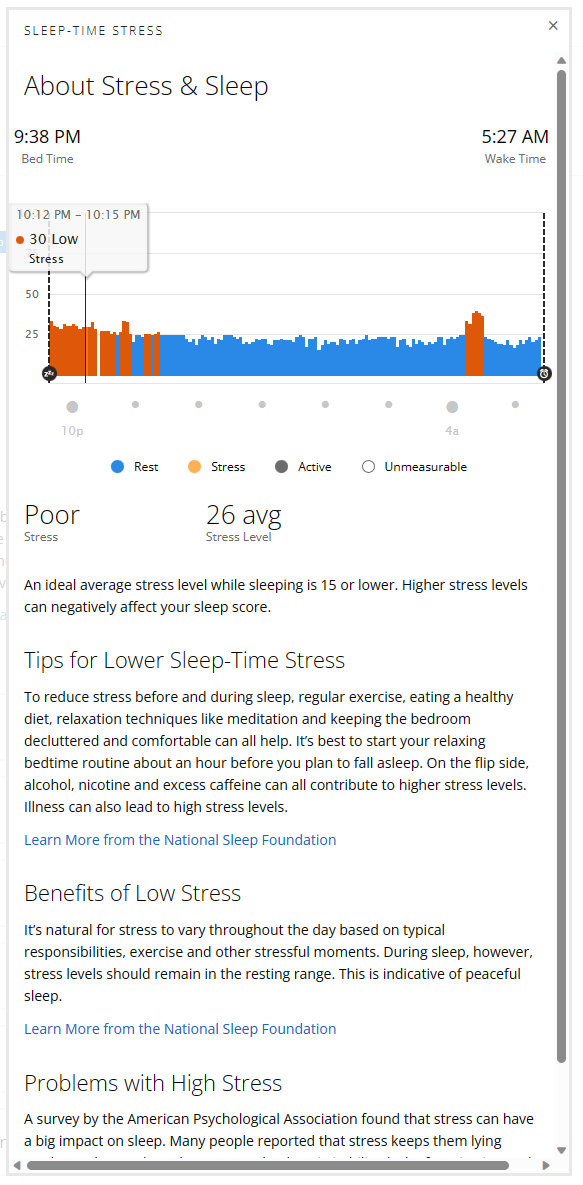
Garmin’s Sleep Score is a simplified yet powerful metric, ranging from 0 to 100, that distills your night’s sleep into a single, easy-to-interpret number. It’s calculated using several factors, including sleep duration, the balance of sleep stages (light, deep, REM, and awake), average stress levels during sleep, and the amount of restlessness or time spent awake throughout the night. Scores are categorized as follows: below 60 is considered poor, 60–79 is fair, 80–89 is good, and 90–100 is excellent.
How to Navigate to Sleep Score in Garmin Connect
Based on the current Garmin Connect app layout:
-
- Open the Garmin Connect app on your mobile device.2.
- Tap More (on iOS, this appears at the bottom right; on Android, it may be a menu icon at the bottom or top)3.
- Tap Sleep Score (or simply Sleep) to see your current score, rhythm, and detailed stats, including sleep stages, heart metrics, and trends over time.
-
Why the Sleep Score Matters—Especially for Cyclists

 Optimized Recovery
- Deep sleep is when your body repairs and regenerates muscles. Garmin indicates that spending 17–35% of sleep in deep sleep is ideal for restoration.
- Body Battery Correlation Garmin’s Body Battery—an indicator of energy reserves—is closely tied to your sleep score. A higher score generally means you’re better primed for high-performance training sessions.
- Elite Athlete Trends Garmin’s 2024 data shows elite athletes (training over 210 miles/week cycling or 95 miles/week running) yield an average sleep score of 74, compared to 72 across all users—highlighting how consistent training and sleep go hand-in-hand.
- Global Comparisons While the global average sleep score in 2024 was 72, users in Iceland and Finland averaged 77—a reminder of how lifestyle, diet and environment can influence recovery quality.
Using Sleep Score to Boost Cycling Performance

Track Trends, Not Just Nights
Don’t overreact to a single low score. Instead, look at week-to-week trends. This helps tailor your training: prioritize hard intervals after consistently high scores and opt for recovery rides when scores dip. Daily markers show individual Sleep Scores (for example, around 50–75 in this snapshot), allowing you to observe highs, lows, and consistency across days.At the top, you’ll typically see time range options like 1 d, 7 d, 4 w, and 1 y, which let you adjust the view to daily, weekly, monthly, or yearly trends.
Why Trend Charts Matter:
-
- Spot patterns like dips in Sleep Score that correlate with specific habits (late nights, workload, workouts, etc.).
-
-
- Track long-term improvements as you adjust your sleep habits.
-
- Identify periods of consistently poor sleep to address proactively.
Match Training Load to Readiness
Use sleep score (and Body Battery) to guide your regimen:
- High score = high intensity training OK
- Low score = shift to recovery mode or active rest
Refine Your Sleep Habits
Enhance your score—and thus recovery—by aiming for:
- 8–8.5 hours of sleep (associated with the top average scores)
- A consistent bedtime and sleep environment
- Avoidance of alcohol, late-night screens, and heavy meals
Supplement with Garmin Index Sleep Monitor
Garmin’s new Index Sleep Monitor—an upper-arm band—offers more comfort-friendly overnight tracking, while still providing full sleep metrics (including skin temperature and respiration) and syncing seamlessly with the Sleep Score.
Summary Table: Sleep Score & Cycling Performance
| Component | Benefit for Cycling Performance |
|---|---|
| Sleep Score (0–100) | Quick gauge of nightly recovery quality |
| Sleep Stages (Deep/REM) | Deep sleep aids muscle repair; REM supports cognitive recovery |
| Body Battery | Energy readiness metric to plan training load |
| Long-term Trends | Guides smart training decisions and recovery balance |
| Index Sleep Monitor | Comfortable, detailed tracking for better sleep insights |
Final Thoughts
Garmin’s Sleep Score offers a compact yet comprehensive lens on your recovery—especially valuable if you’re serious about cycling performance. When combined with mindful training planning and consistent sleep hygiene, it’s a tool that empowers smarter, data-backed decisions.
Feel free to download and use these visual charts in your blog, share them with your cycling community, or embed them in your training log. Ride well—and sleep even better!


One Response