The Dehydration Decoupling: Managing Real-Time Metabolic Cost
Managing a sudden dehydration decoupling is the absolute secret to keeping your internal engine from running scorching hot during baseline workouts. Consequently, I started my Monday morning baseline endurance ride feeling like absolute gold, completely unaware that this metabolic shift was about to derail my metrics. Looking at my wrist when I woke up, all the green lights were flashing in the Garmin Connect app. I logged a solid 7h 15m of sleep, earning a Sleep Score of 80 with an exceptional 1h 31m of deep, restorative sleep. My overnight HRV averaged 32 ms, keeping my 7-day trend perfectly “Balanced,” while my Body Battery recharged by a strong +50 points. My systemic stress was sitting at a peaceful 1d score of 16.
When I clipped in, my Garmin Edge head unit confirmed what I felt, serving up an initial Performance Condition (PerfCon) of +5.
But an hour later, I was staring at a crushing PerfCon score of -2.
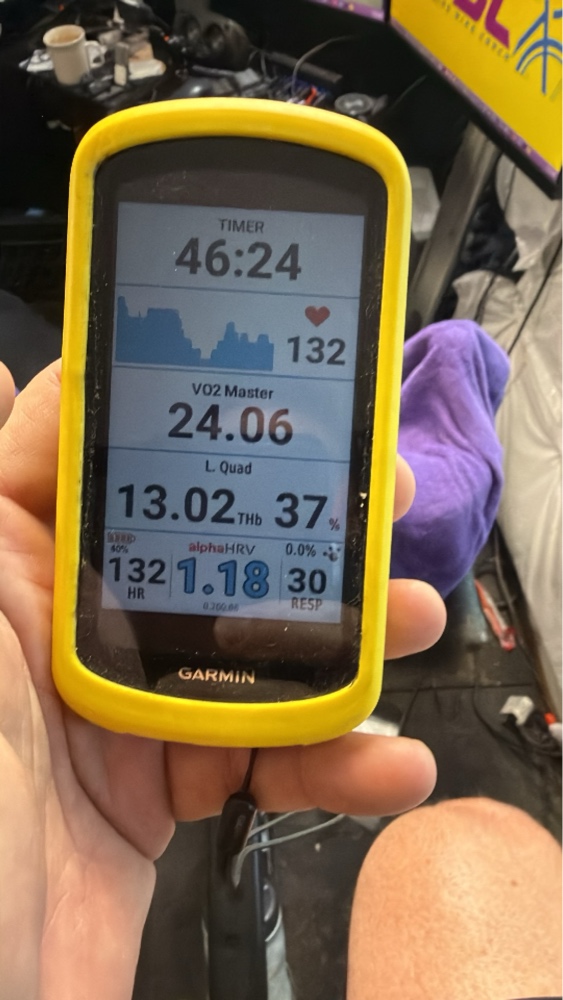
What actually happened? Did my fitness vanish in 60 minutes? No. In contrast, I fell victim to a classic case of Dehydration-Induced Cardiovascular Drift, and my Garmin caught it red-handed. Because I was executing a technical baseline ride with a VO2 Master metabolic mask tightly strapped to my face, I never took off the mask to hydrate. Driven by nothing but a single pre-ride cup of coffee, my blood plasma volume shrank, my blood thickened, and furthermore, my internal engine began running scorching hot.
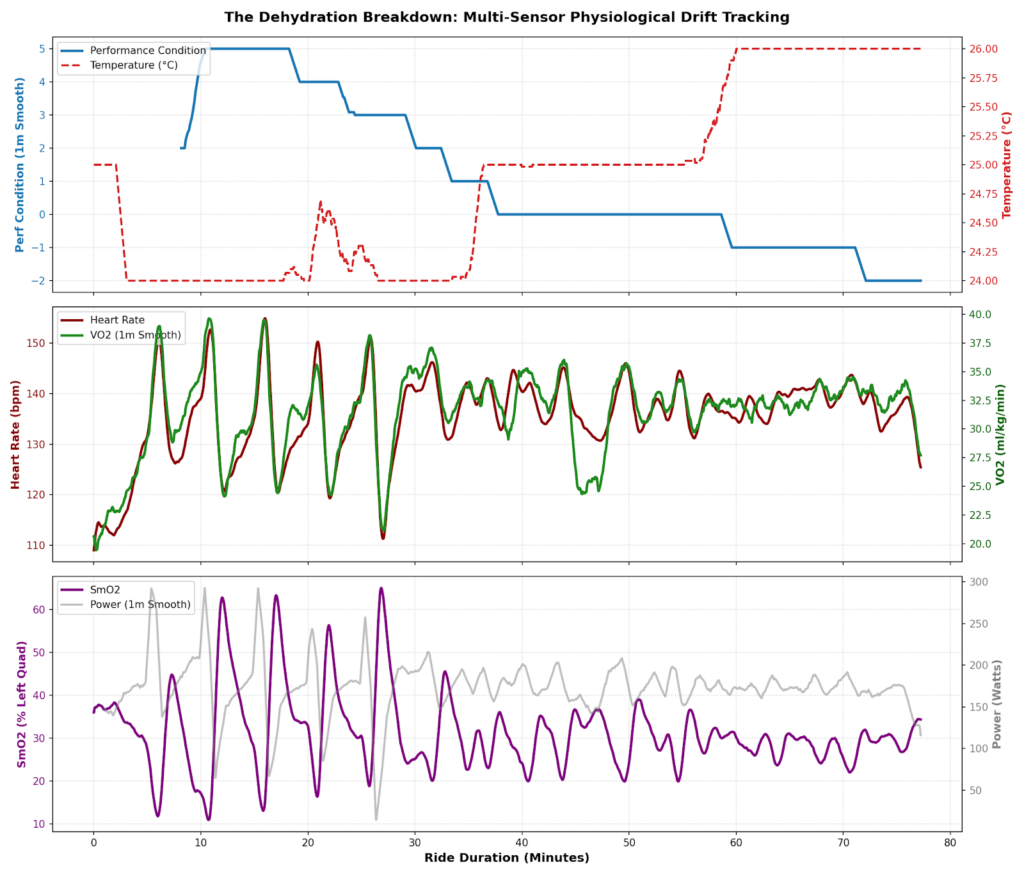
Thermodynamic Drift: Tracking a Dehydration Decoupling
If I only looked at my external power file, I would think I rode a textbook, steady-state endurance session. However, when my thermodynamics work against me, even a low-intensity zone begins running hot. Comparing the first 15 minutes of the ride directly to the final 15 minutes using clean, whole-number metrics reveals the real-time breakdown:
| Physiological Parameter | First 15 Minutes | Final 15 Minutes | The Internal Shift |
|---|---|---|---|
| Performance Condition | +5 | -1 | -6 points |
| Power (Output) | 180 W | 169 W | -11 W |
| Heart Rate (Internal Load) | 130 bpm | 138 bpm | +8 bpm |
| DFA α1 (Autonomic Balance) | 1.15 | 1.07 | -0.08 |
| Muscle Oxygenation (SmO2) | 32.29% | 28.70% | -3.59% |
| Oxygen Consumption (VO2) | 29.60 ml/kg/min | 32.48 ml/kg/min | +2.88 ml/min |
| VO2 Master Direct Respiration | 29 breaths/min | 31 breaths/min | +2 breaths/min |
Specifically, my Aerobic Decoupling (Pw:HR) across the two halves of the ride clocked in at 3.89%. While a casual look suggests stability (under the standard 5% threshold), the extreme ends of the ride show a complete structural breakdown. I was dropping nearly 11 watts while my heart rate surged by close to 8 beats per minute!
The Last 45 Minutes: Connecting the Internal Metrics
To see exactly why Garmin’s Performance Condition plummeted from a positive helper to a negative warning, I isolated the final 45 minutes into three distinct 15-minute intervals. Consequently, tracking our high-fidelity heart rate variability trends highlights a clear timeline:
- The Tipping Point (First 15m of Last 45): I was maintaining 174 W at a heart rate of 138 bpm. DFA α1 sat exceptionally stable at 1.15. PerfCon was still barely hanging on in positive territory at +0.32.
- The Downward Slide (Middle 15m of Last 45): I fought to keep the output steady at 176 W. My heart rate stayed flat at 137 bpm, and DFA α1 held the line at 1.11, but my local muscle tissue was suffocating—quad muscle oxygenation (SmO2) dropped into the 29% range. PerfCon noticed the expanding internal struggle and flipped negative to -0.24.
- The Collapse (Final 15m of Last 45): My body hit a wall. Power fell away to 169 W, yet my heart rate rose to its peak average of 138 bpm. DFA α1 compressed to its lowest value of 1.07. This specific type of dehydration decoupling wasn’t an intensity issue; it was a pure fluid-dynamics failure. My VO2 consumption reached its highest point (32.49 ml/kg/min), and my breathing became shallow and fast at 31 breaths/min. Performance Condition bottomed out at -1 (hitting a real-time low of -2).
The Physiological Fluid Breakdown
Why did this text-book breakdown occur? Because my plasma volume dropped from zero fluid intake, my stroke volume decreased dramatically. Therefore, my heart had to beat faster to move a smaller volume of increasingly thick blood. Meanwhile, my quad muscles (SmO2) had to extract oxygen aggressively from a highly restricted supply. As a result, I was consuming more oxygen (VO2) and breathing harder just to produce less power output.
Autonomic Stability vs. Fluid Dynamics
Interestingly, my DFA α1 stayed safely above 1.00 (1.15 → 1.07) for the duration of the ride. This explicitly means my autonomic nervous system was never pushed out of a true aerobic state—I wasn’t accumulating systemic lactate. Thus, my distress wasn’t an intensity issue; it was a pure fluid-dynamics failure. Performance Condition accurately tracked this rising metabolic cost of power generation and flagged the degradation in real time.
Algorithm vs. Reality: Respiratory Rate Verification
To further audit the internal strain of this dehydration decoupling, I compared how different sensors tracked my breathing. Both Garmin and AlphaHRV attempt to calculate respiratory frequency indirectly by analyzing mathematical variations in your heart rate intervals (Respiratory Sinus Arrhythmia). Here is how those calculated estimations matched up against the direct physical reality of the VO2 Master metabolic mask:
| Sensor Source | First 15m Average | Final 15m Average | The Drifting Shift |
|---|---|---|---|
| VO2 Master (Direct Metabolic Truth) | 29 bpm | 31 bpm | +2 breaths |
| AlphaHRV (Calculated via HRV) | 28 bpm | 30 bpm | +2 breaths |
| Garmin Native (Calculated via Strap) | 26 bpm | 27 bpm | +1 breath |
Ultimately, AlphaHRV completely outshines Garmin’s native metrics in this scenario. It tracked exceptionally close to the metabolic truth, running exactly one breath behind my real physical ventilation rate across the entire session. Crucially, AlphaHRV pinned the identical +2 breath upward drift as my blood plasma volume dropped. In contrast, Garmin’s native algorithm heavily under-reported my respiratory rate and completely missed the magnitude of the thermal shift, only showing a +1 increase. When managing thermodynamic drift, AlphaHRV acts as a far more sensitive tool to detect early respiratory distress.
The Voltmeter: Why Hydration Controls Your Score
This data highlights a critical rule I emphasize in my coaching philosophy: Power is merely a metric of external output, not an indicator of your internal metabolic state. Hydration acts as the ultimate volume dial for your cardiovascular system; when fluid drops, your internal resistance climbs.
- Wattage: Looked perfectly flat, steady, and stable on paper.
- Heart Rate, DFA α1 & VO2: Progressively drifted, signaling an inefficient, overheating engine working against heavy thermodynamics.
- Performance Condition: Provided the perfect aggregate voltmeter, exposing the exact moment my output became too physiologically expensive to sustain.
Don’t treat your Garmin’s Performance Condition as an arbitrary “mood ring.” It is a sophisticated calculator tracking the real-time efficiency of your engine, making it the perfect tool to detect a dehydration decoupling before your power completely plummets.