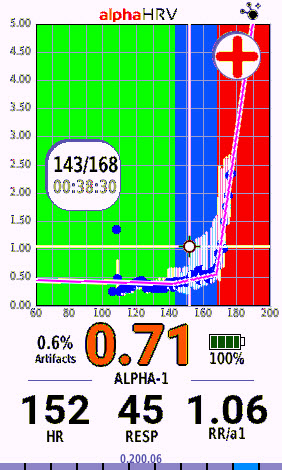
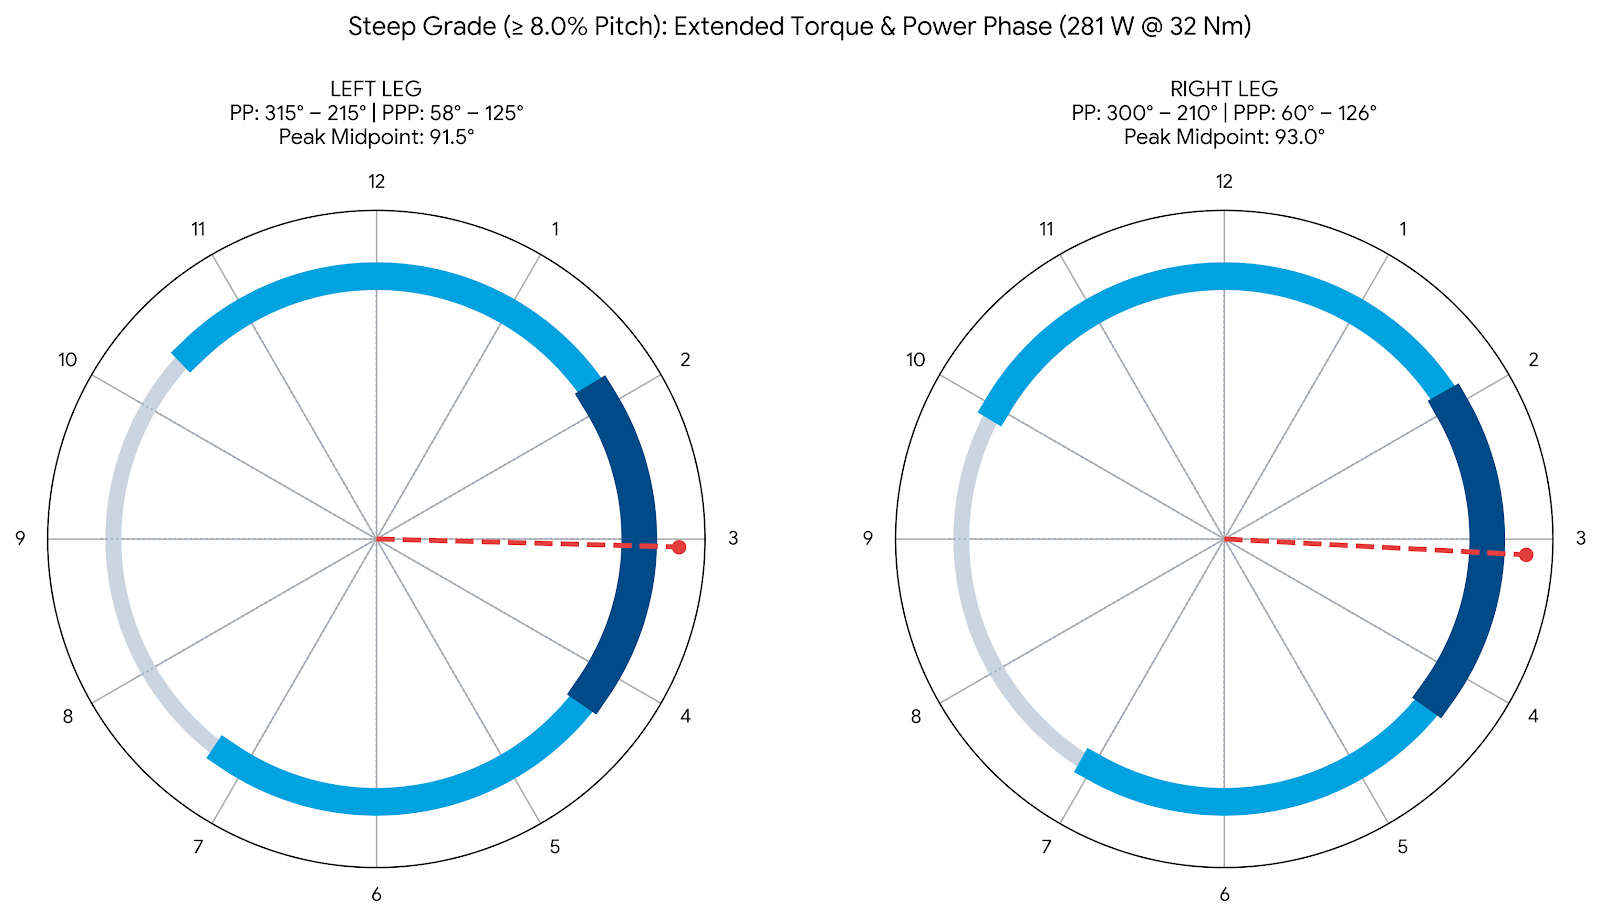
Analyzing VO2 Master data reveals a stark reality check from my ride this Friday morning. I expected a straightforward, low-intensity recovery base day. Instead, my body gave me a loud warning. Even though I intentionally kept my external intensity low, the internal cost of the ride was exceptionally high.
This ride is a textbook example of why we must monitor internal metabolic markers. We cannot blindly rely on external metrics like power. When your system carries deep-seated exhaustion, even traditional Zone 2 power can drive your physiology completely out of balance.
The Story of the Ride: Tracking Garmin Performance Trends
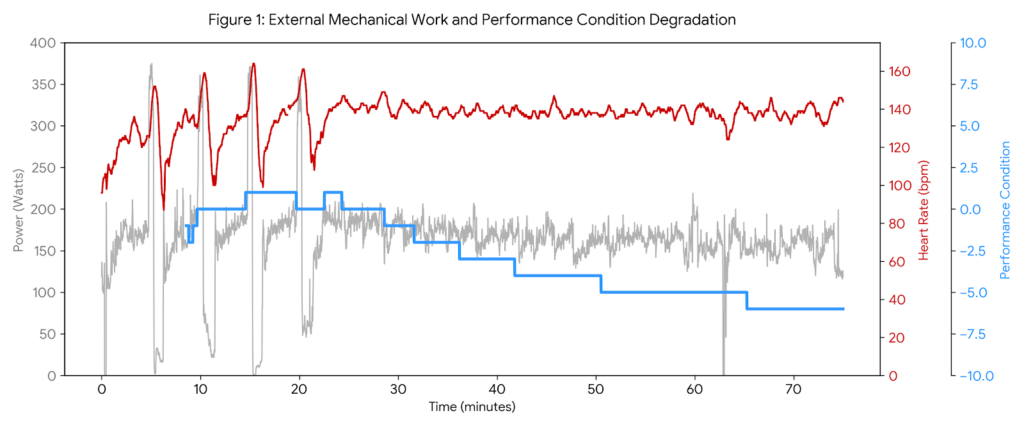
From the very first pedal stroke, Garmin’s Performance Condition (PerfCon) signaled trouble. It started off poor. Then, it continuously degraded throughout the entire session.
In response, I lowered my targets. I focused heavily on internal pacing. I attempted to keep DFA Alpha-1 above 1.15 to remain strictly aerobic. I also tried to hold my heart rate within my traditional Zone 2 boundaries. But my physiology refused to cooperate.
As the ride went on, my heart rate and internal stress indicators migrated steadily upward. This matched the downward slide of my Performance Condition. The mechanical work was low. Yet, the metabolic cost was escalating. This left me completely exhausted by the end.
Key Physiological Metrics and Data Cleaning Gaps
Why did this low-intensity ride feel so grueling? To find out, we must look at the interaction of several critical internal metrics.
Autonomic and Cardiovascular Stress Markers
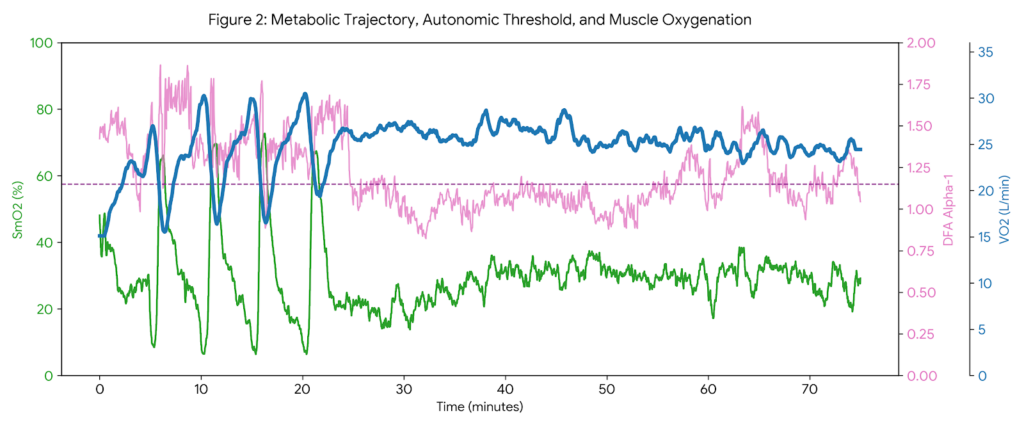
- DFA Alpha-1 & RR-A1 Ratio: Early on, Alpha-1 stayed elevated. This shows my nervous system was successfully managing the initial mechanical load. However, exhaustion soon took over. Alpha-1 experienced a slow, downward migration below the 0.75 threshold. This trend indicates an accelerating loss of aerobic efficiency. It also shows a clear shift toward high sympathetic activation.
- Traditional Heart Rate Migration (Cardiovascular Drift): My heart rate steadily climbed over time despite lowering my intensity. This classic cardiovascular drift indicates that stroke volume was decreasing due to systemic fatigue. This drop forced my heart to beat faster just to sustain a low power output.
- Stamina Drop: Garmin’s Stamina metric beautifully captured this structural depletion. It steadily unwound from the start. This trend shows that my actual potential stamina was severely compromised before I even clipped into the pedals.
- EPOC & Load Focus: My heart rate remained elevated and drifted higher relative to power. Because of this, the accumulation of EPOC was disproportionately high for a recovery day. This inflated my overall Load Focus, tracking it more like a hard aerobic session.
- Aerobic Training Effect: The ride resulted in a significant Aerobic Training Effect. The original plan was a simple recovery day. Instead, systemic strain converted this into a high-yielding aerobic stress event. My body treated this as a hard day at the office.
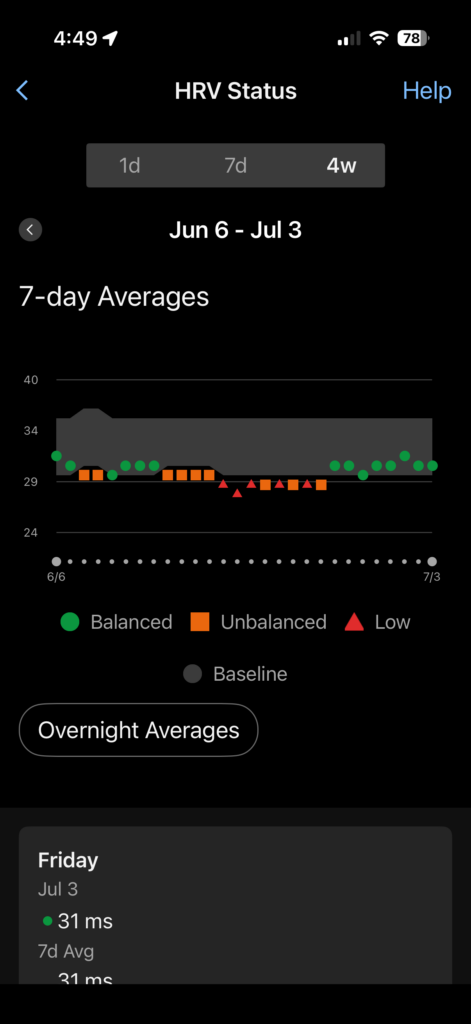
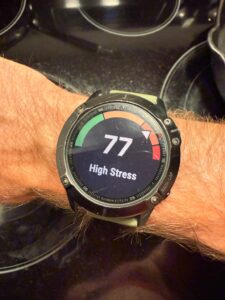
Deep systemic fatigue manifested: Suppressed 7-day HRV averages pairing with high daytime autonomic stress indicators.
The Final 53 Minutes: Decoding the VO2 Master Data Parabola
The final 53 minutes of the workout perfectly illustrate this metabolic breakdown. As systemic fatigue deepened, I was forced to continually decrease my power output. I did this to keep my heart rate from spiking out of control. It also prevented Alpha-1 from completely collapsing. This adjustments formed a visible wattage parabola.
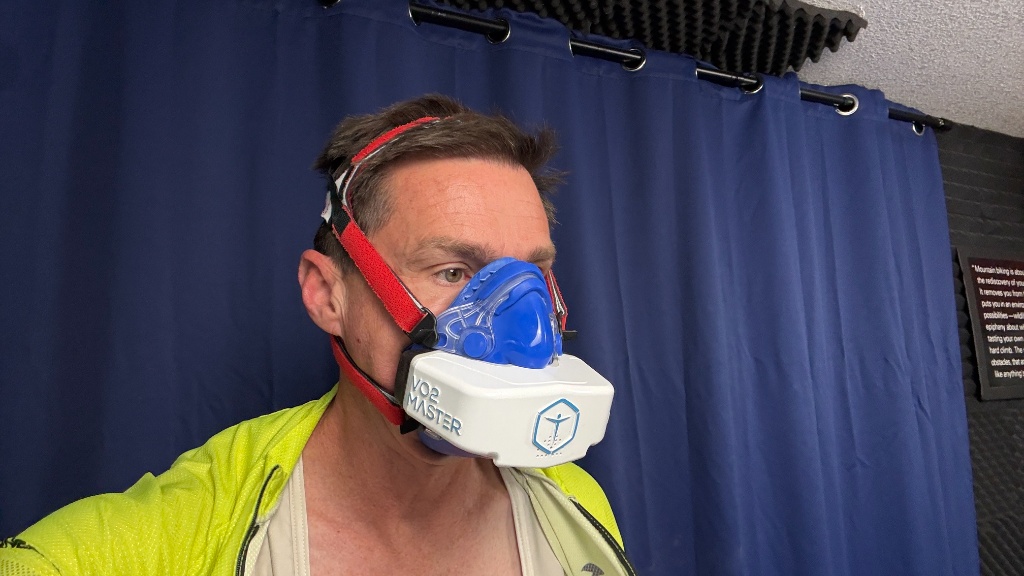
During this final 53-minute block, the clean file data reveals a stark metabolic uncoupling. Mechanical work averaged 165.1 W. Yet, my body paid a massive aerobic premium to sustain it. The effort demanded an average oxygen consumption (VO2) of 25.58 L/min. It also forced an elevated respiratory frequency averaging 31.38 breaths per minute.
I wanted to maintain total scientific integrity in this analysis. Because of this, the periodic “naught” readings were completely stripped out. These are the regular intervals every 3 to 4 minutes where the device stops measuring metrics to sample ambient air. By utilizing cleanly interpolated averages across these calibration gaps, we get an accurate look at the escalating internal cost.
Validation: Comparing Wearable Sensor Algorithms
We isolated the 20-minute Mean Max Power (MMP20) block to evaluate sensor accuracy under high systemic strain. During this window, power averaged 175.9 W. Removing the ambient air drops from the VO2 Master data allowed a direct head-to-head validation of the real-time ventilation metrics:
- VO2 Master (Actual Measured Standard): 30.60 breaths/min
- Native Garmin Field Algorithm: 30.33 breaths/min
- Alpha HRV Calculated Field: 33.90 breaths/min
The native Garmin respiration rate algorithm proved to be phenomenally accurate during this sustained block. It tracked just 0.27 breaths/min below the actual gas-exchange measurements. Meanwhile, the Alpha HRV field calculation over-estimated the ventilation rate by 3.30 breaths/min.
The Takeaway: Trust Your Physiology First
This ride confirms a vital rule of elite coaching. **Power means nothing if the underlying physiology is screaming.** When your Performance Condition starts poor and your internal metrics migrate in the wrong direction, it’s a sign of profound systemic exhaustion. Lowering your power targets is a smart tactical adjustment. However, it doesn’t change the fact that your body is operating under a high internal load. When you are deeply fatigued, even a base day can become an exhausting metabolic drain.
“Performance Condition” gets ONE PARAGRAPH of information in the official Garmin website. I’m here to do a LONG-TERM, DEEP DIVE into this metric and all of the other metrics that make the Garmin Connect Ecosystem so thorough. They’re data rich, but explanation poor, and I’m here to change that. Support my work, or contact me for a personal meeting and review.

I teach these concepts every morning, LIVE, at 0500pst, in my Virtual Studio. The workouts are Group settings, with INDIVIDUALIZED GOALS AND PARAMETERS. It’s dynamic to the individual, the micro, meso, and macro agenda. All done using GARMIN METRICS. If you want to learn more, join me in my studio, and let me help you, help yourself. It’s fun, supportive, and educational. See you there!