Beyond the Score
The Garmin Guru Series | Decoding the Fast-Adapter | By OnlineBikeCoach.com
Programming Reverse Fibonacci intervals is the ultimate way to shatter the lie of the “Static Zone” in high-performance cycling. We move past the idea that a single FTP test or a heart rate formula from a 1980s textbook is a life sentence. Chasing a wattage “carrot” on a screen is a hollow victory if you ignore the fact that your internal environment is shifting every single second.
Last week, I discussed the “Power Illusion.” Today, I am proving why your internal metrics—VO2, SmO2, and Respiratory Rate—are the only truths that matter. Using Reverse Fibonacci intervals (8-5-3-2-1), I have mapped the evolution of a “Fast-Adapter.” The results shouldn’t just change how you train; they should change how you look at your Garmin head unit forever.
The Evolution: How Reverse Fibonacci Intervals Change Your Threshold
The most dangerous phrase in coaching is “My threshold is X.” Threshold is not a fixed point; it is a metabolic state. Over the last three weeks, I have tracked my own internal recalibration. I haven’t just gotten “faster”—I have changed the way my body manages oxygen flux.
The Evolution of My Threshold
| Timeline | VO2 Threshold | Avg. Power | HR (bpm) | SmO2 Floor | DFA alpha1 |
|---|---|---|---|---|---|
| 3 Weeks Ago | 42 | 225W | 162 | 15% | 0.65 |
| Last Week | 45 | 240W | 166 | 12% | 0.55 |
| Today | 48.7 | 255W | 170 | 8% | <0.5 |
Look at those numbers. Three weeks ago, I was “redlining” at 42 mL/kg/min. Today, that is my baseline recovery pace. My threshold now sits at roughly 84% of my absolute ceiling (58 mL/kg/min). By pulling the floor closer to the ceiling, I have effectively expanded my aerobic workspace. I am producing more power (255W) at a lower relative physiological cost than I was just 21 days ago.
The Protocol: Why Reverse Fibonacci Intervals Win
Most riders default to “Steady State” intervals. They do 4×8 minutes and call it a day. But those efforts often fail to elicit a true VO2 stimulus because they allow the body to find a “comfortable” metabolic rhythm. The Reverse Fibonacci intervals protocol is designed to prevent that rhythm. By starting with an 8-minute threshold anchor, I purposefully induce a state of high-intensity fatigue, then use descending durations to “hang” at the VO2 ceiling.
Interval Focus: The Metabolic Redline
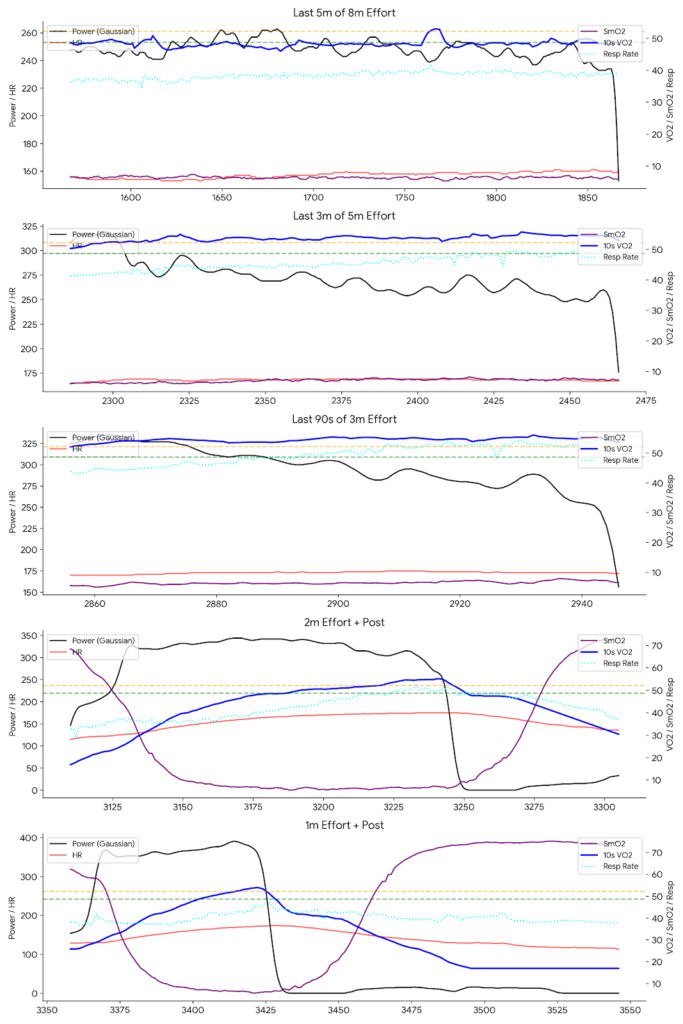
Decoding Data from Reverse Fibonacci Intervals
| Interval | Gaussian Power | Peak VO2 | HR (% HRR) | SmO2 Floor | Result |
|---|---|---|---|---|---|
| 8 Min | 255W | 52.9 | 85% | 6.4% | Threshold Anchor |
| 5 Min | 276W | 55.7 | 89% | 7.0% | VO2 Stimulus |
| 3 Min | 303W | 56.1 | 90% | 6.6% | VO2 Stimulus |
| 2 Min | 308W | 55.2 | 88% | 6.3% | VO2 Stimulus |
| 1 Min | 366W | 54.0 | 86% | 6.7% | Final Flux |
Nothing is Static: The Dynamic Nature of Effort
This is where most coaches lose the plot. They give you a heart rate zone and tell you to stay in it. But I am here to tell you that your zones do not exist in a vacuum.
1. The Shifting Heart Rate Zone
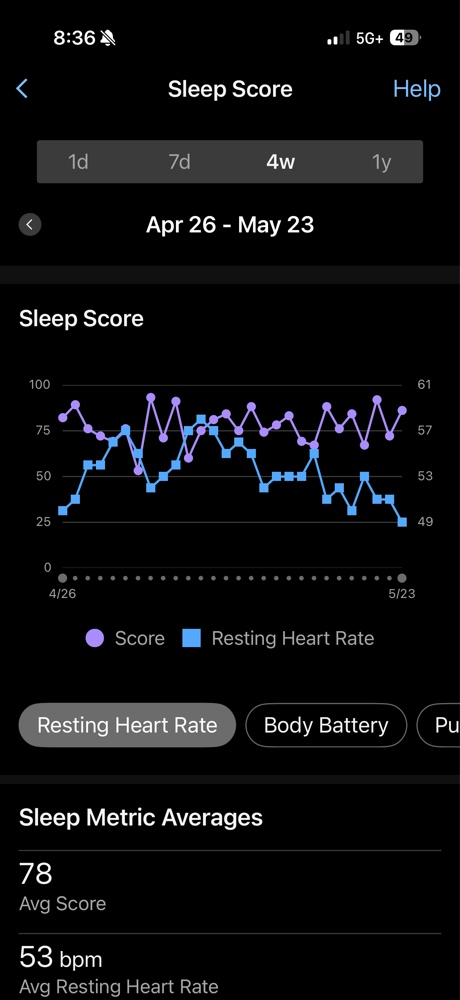
Is 170 bpm always my threshold? No. On a day with 5 hours of sleep and high life stress, my heart rate might reach 170 bpm at 220W. Today, despite poor sleep, my consistency in training allowed me to achieve a massive VO2 response at a lower-than-expected heart rate (161 bpm peak on the anchor). Training solely to a HR “target” often leads to missing the stimulus entirely.
2. SmO2: The Local Truth
Muscle Oxygenation (SmO2) is the most dynamic metric I track. It tells me exactly how much oxygen the quad is extracting. At threshold, my SmO2 “nadir” (floor) has shifted from 15% down to 8%. This isn’t just “fitness”—it’s a fundamental change in my peripheral biochemistry.
3. Respiratory Rate: The Engine’s Cooling Fan
Watch your breathing. It is the most sensitive indicator of metabolic stress. As my threshold rises, the point at which my respiratory rate spikes (The Respiratory Compensation Point) also shifts. Today, I saw a massive spike in ventilation only in the final 3 minutes of the set. My body has delayed the onset of “ventilatory panic,” allowing me to stay in control for longer.
“It’s not the night before that matters, but all the nights and mornings before that. Consistency is the only metric that never lies.”
The Garmin Guru Advantage
Consistency, consistency, consistency. We cannot rely on the physics of wattage as our only carrot. We have to rely on the INTRINSIC physiology that we can view on our Garmin screens. Using respiratory rate, heart rate, DFA Alpha 1, and SmO2, we can finally see the engine under the hood.
ALL of this can be found on a single head unit. Using 3rd party fields like AlphaHRV and Moxy, you can turn your Garmin into a laboratory that rivals the pros. Furthermore, no one is looking at this like I am, and publishing the results, for free. I do this because I want you to stop being a slave to your power meter and start being a master of your own physiology.
Check out my earlier post for the foundation of this logic: The Power Illusion: Why Watts Aren’t Everything.
Train with Me Virtually
Ready to apply these physiological hacks to your own training? Join me for a live session in my virtual studio.
Join My VQ Velocity Studio
If you find this free data and analysis helpful, consider supporting the research!