Tire Selection vs. Terrain: How Vittoria Rubber Saved 7.5% Effort on the Halo Loop

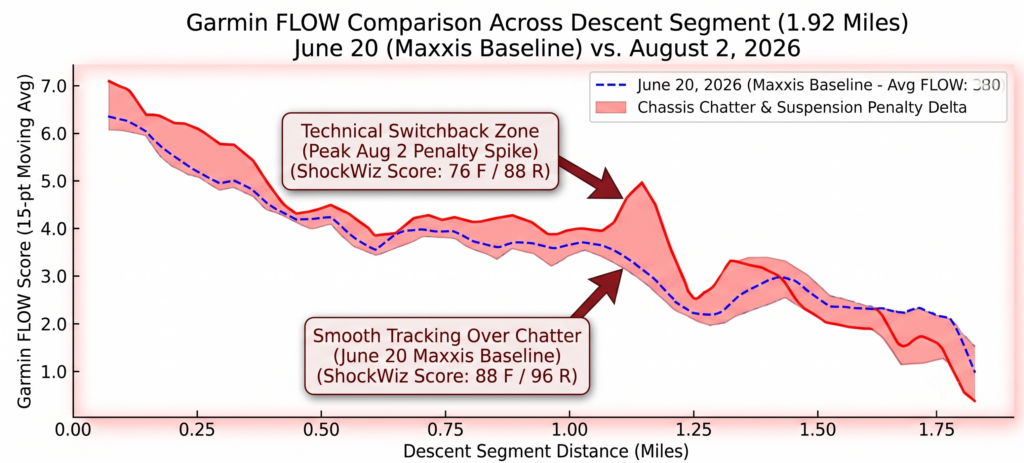
A line graph comparing Garmin FLOW scores for a 1.92-mile descent on June 20, 2026, and August 2, 2026. A blue dashed line represents the June baseline with an average FLOW of 3.80, and a red solid line represents the August data. A red shaded area highlights the "Chassis Chatter & Suspension Penalty Delta." Two callout boxes point to a spike at the technical switchback zone, noting a higher penalty with lower ShockWiz scores on August 2 compared to smooth tracking and higher ShockWiz scores on June 20.

Tire Selection vs. Terrain: How Vittoria Rubber Saved 7.5% Effort on the Halo Loop By Richard Wharton | August 2, 2026 Proper tire selection on technical mountain bike trails plays a far greater role in overall efficiency than raw horsepower alone. If you ride strictly by feel, hot, dry summer dirt on Peavine Mountain’s benchmark […]