Garmin Stamina and Stamina Potential May Just Be the Enlightenment Tool for Cyclists and Triathletes!

With the release of the ’40 Series of Garmins (the 540, 840 and 1040), as well as a host of watches, Garmin has included the Garmin Stamina and Potential feature. This native Field looks at energy use, intensity, heart rate and other elements to gauge ‘Just how much is left in the tank’ when a cyclist or runner is exercising. It’s one more tool that a cyclist, runner, or triathlete might be able to use for training, breakthroughs, or in an event.
What Is Garmin Stamina?
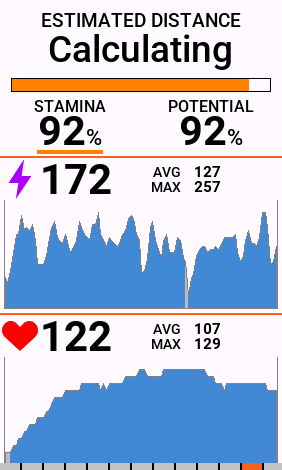
Garmin Stamina is defined as a visible metric that reveals just how much a cyclist has left, in terms of residual energy, power and work, at any capacity, over time. When a cyclist rides harder, Stamina drops faster. When the cyclist recovers, Stamina rebounds. Garmin Stamina is measured in %. If a cyclist is fresh and recovered, Stamina will start at 100%. If this is their second workout of the day, or they haven’t adequately recovered from a previous effort, it may start at <100%.
What is Garmin Stamina Potential?
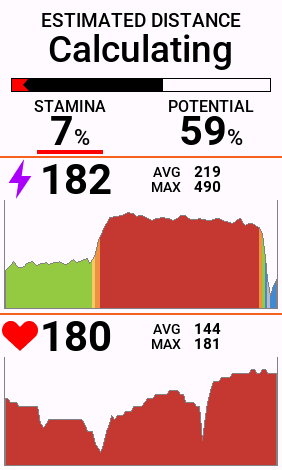
Garmin Stamina Potential shows just how much fatigue is affecting a cyclist’s ability to generate power. I remember Dr. Allen Lim, in 2004, telling me about requiring his athletes to use at least 600 KiloJoules of energy prior to performing intervals, because “500 watts after 600 KiloJoules is a LOT HARDER than 500 watts after just 200 KiloJoules!” And he’s right.
Garmin Stamina begins on a scale of 100-0%, and it declines with Garmin Potential as a ride progresses.
The Garmin Stamina Page On Your Garmin Head Unit
If you have a new ’40 Series, turn on the Garmin Stamina Page by following these steps:
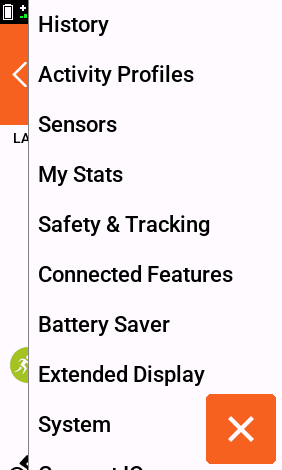
- On the main screen, tap on the ‘Sandwich’ Square.
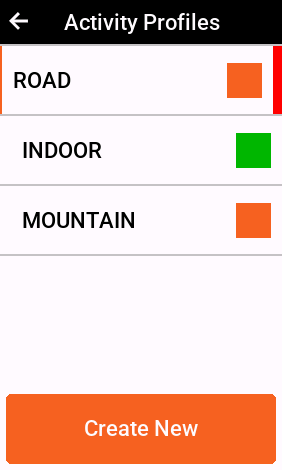
- Tap on ‘Activity Profiles’.
- Pick a Profile (I have ‘Road’, ‘Indoor’, and ‘Mountain’).
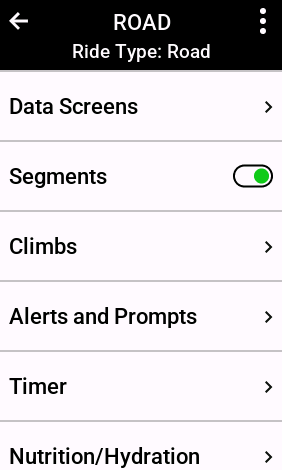
- Tap on ‘Data Screens’.
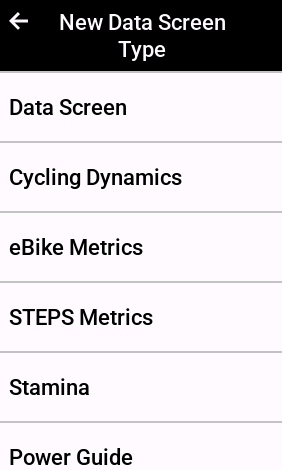
- Scroll up and down and look to see if ‘Stamina’ is shown as a page or not. If not, press ‘Add New’.
- You should find ‘Stamina’ in the options, and add it.
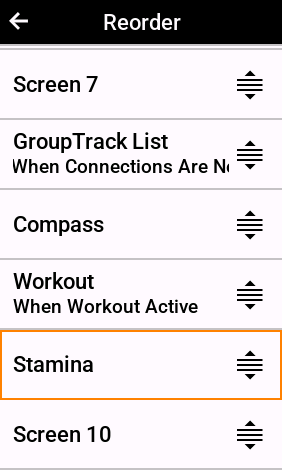
- The Garmin head unit will then offer you ways to slide the ‘Stamina’ page around in order, until it’s where you want it. As a Lefty, I tend to swipe Left-to-Right, so mine is Second-from-Last.
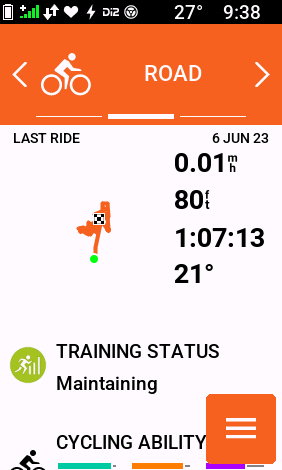
Back-Arrow out until you get to the main screen, and then tap on the Profile itself. Swipe until the screen shows up.
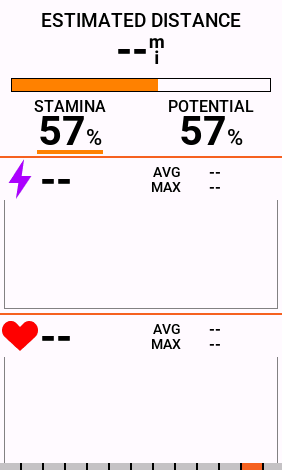
There are 3 Fields, including a Stamina Bar with Stamina and Stamina Potential in numbers, followed by a Wattage Graph, and finally, a traditional Heart Rate Graph. Above the Stamina Bar is an ‘Estimated Distance’ value, and it makes me wonder if that might not be useful for an Ultra-Cycling event. Hmmm.
How to Use Garmin Stamina and Stamina Potential

Remember the ground rules:
- Once you start a ride file, Stamina and Stamina Potential will begin to decay.
- The rate of decay is dependent upon time spent at different intensities.
- At low intensities, Garmin Stamina and Stamina Potential will decay at the same rate. If you ride at a higher intensity, the Garmin Stamina value will drop faster than the Garmin Stamina Potential value.
- Garmin Stamina can rebound, but it will never be higher than Garmin Stamina Potential.
- “500 watts after 600 KiloJoules is harder than 500 watt after 200 KiloJoules!”
A 20-Minute Effort With Stamina and Stamina Potential
I’ve been using Garmin Stamina and Stamina Potential for a couple of months now, especially in my Indoor Virtual Studio over at VQ Velocity. We recently rode some ubiquitous 2 x 20 minute efforts right at or just above Threshold. Here are the results of the first interval.

I’ll crowd the chart a bit, to show some other physiological metrics, just so you can see how ‘hard’ this interval really was.

On-Screen, the Page looked like this…
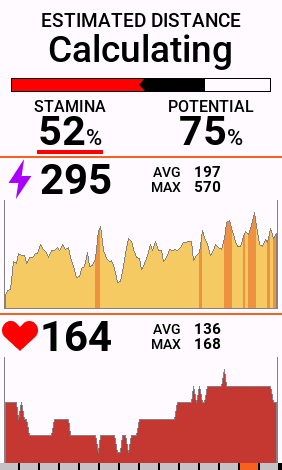
Look carefully at the Red, Black, and Clear Line. You’ll see an ‘arrow’ where the red meets the black. This is the point where the Garmin Stamina is declining faster than the Garmin Potential Stamina. Red means decline. Green means recovery. Potential will NOT recover during a ride. It may plateau, but it won’t rebound.
For context, here’s the graph of the SECOND 20-minute interval……

Billat 60-60s With Stamina and Stamina Potential.

Above is the post-ride overview of a set of Billat 60-second intervals with 60-second recoveries. Notice how Garmin Stamina pulls Stamina Potential down over the course of the ride.
Here’s what the ride looked like on my Garmin 1040.

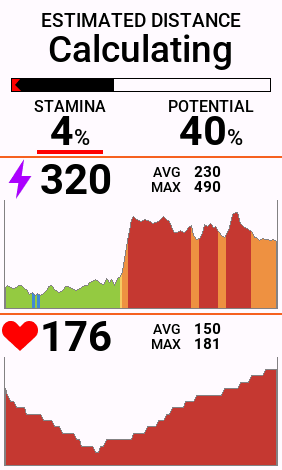
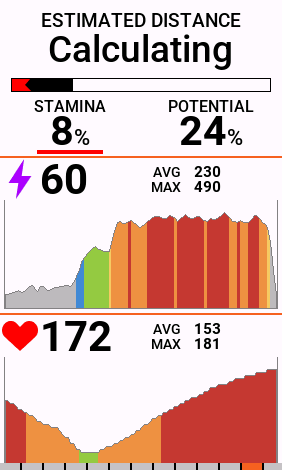
For context, here is a link to the ride itself on Garmin Connect…
And here is an image of what Garmin gave this ride, in terms of Aerobic TE, Anaerobic TE, EPOC, and Training Effect.

Pay Attention to Garmin Stamina and Stamina Potential
Garmin has been at this game of product development now for about two decades. They bought a company (FirstBeat) with even deeper roots and history. They’re an Aviation company, a sport metrics company, and a travel logistics company. But they’re really onto something here. These developments use a history of science, a slightly conservative approach, but one that is loading features into rugged devices, and then helping recreational athletes improve their fitness in a holistic way. That’s what’s so fascinating about the Garmin Ecosystem. Their motto is, “Beat Yesterday.” And as both a coach and an athlete, using features like Garmin Stamina and Stamina Potential, I am.

I’ll post later about the possibilities of BREAKING this fatigue model, and how the model later adapts, but it’s really rare.
Thanks for reading, and ENJOY THE RIDE!